During the past decade the adviser industry was shaken up and changed forever. New competitors, products, shifting business models and regulations made many advisers feel the discomfort that change can bring, while some saw the glimmer of opportunity that accompanied the shake up.

Introduction
For years, smaller asset managers in the local industry have argued that their size gives them greater trading agility compared to larger, more established peers. The implication is that this agility could translate into better performance. While that link may not be clearly supported by empirical evidence — and falls outside the scope of this article — the analysis that follows will explore whether smaller size does in fact, offer greater trading agility when investing in equities on the local bourse.
Methodology
This analysis uses the following assumptions:
What is Average Daily Volume (ADV)?
ADV represents the average number of shares traded per day over a given period. In this analysis, we use the 3-month ADV, which helps smooth out daily volatility and provides a more stable view of liquidity and market depth.
Why use ADV trade limits?
The ADV limits used in this analysis are hypothetical scenarios designed to illustrate how different levels of trading constraints affects execution times across various AUM levels. While some managers apply internal guidelines to manage market impact, there is no universally accepted standard or regulatory rule governing these thresholds.In practice, some managers may apply even more conservative limits — trading less than 10% of ADV — which would further amplify the trading constraints.
Why these AUM levels?
As at 31 July 2025, the average fund size among the 50 largest funds in the (ASISA) South African Equity SA General category was just under R5 billion, with the largest funds managing slightly more than R30 billion.
We have included higher AUM assumptions to reflect the size of some popular multi-asset funds, particularly in the (ASISA) South African MA High Equity category. For example, the largest fund in this category had a fund size of R227 billion as at 31 July 2025, with a circa 37% allocation to local equities (including listed property), equating to approximately R84 billion. Another fund in the same category had a fund size of R138 billion, with a circa 42% exposure to local equities (including listed property), translating to roughly R58 billion.
Importantly, these figures reflect only the size of a specific collective investment scheme (CIS) and exclude segregated mandates, life portfolios and other funds managed by the same asset manager. The total amount invested in local equities could be substantially higher, which is why we have incorporated larger AUM scenarios in this analysis.
Trading constraints across the JSE: Top 40, Mid-Caps, and Small Caps
To illustrate the constraints, we have divided the JSE All Share Index into three groups: Top 40, Mid-caps, and Small caps — we have highlighted a few examples of each.
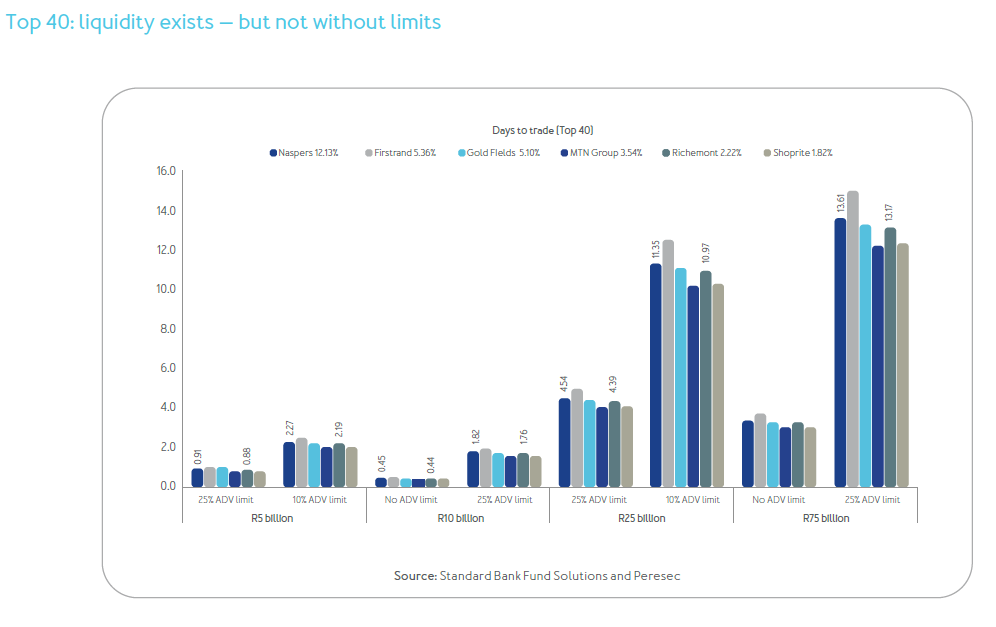
Consider Naspers, the largest company by market cap on the JSE, with a 12.13% index weight. Now suppose a R5 billion fund wants to allocate to Naspers at benchmark weight. At a 25% ADV limit, it would take around 0.91 days to complete the trade. At 10%, that number rises to 2.27 days.
Now, imagine a R25 billion fund — still smaller than some of the largest funds in the ASISA South African Equity SA General category — doing the same. With a 25% ADV limit, execution would take 4.54 days; at 10%, it stretches to 11.35 days — more than two full trading weeks.
Let us take another Top 40 stock: Richemont. Assume a R10 billion fund wants to sell its benchmark-weight position (2.22%). With no ADV constraint, it would take just 0.44 days. At 25%, that extends to 1.76 days, and at 10%, to 4.39 days. But if a R75 billion fund were to do the same, it would take 3.29 days without a limit, 13.17 days at 25%, and a lengthy 32.92 days at 10% ADV.Similar patterns are visible with other large-cap names such as FirstRand, Gold Fields, MTN, Shoprite, and Remgro.
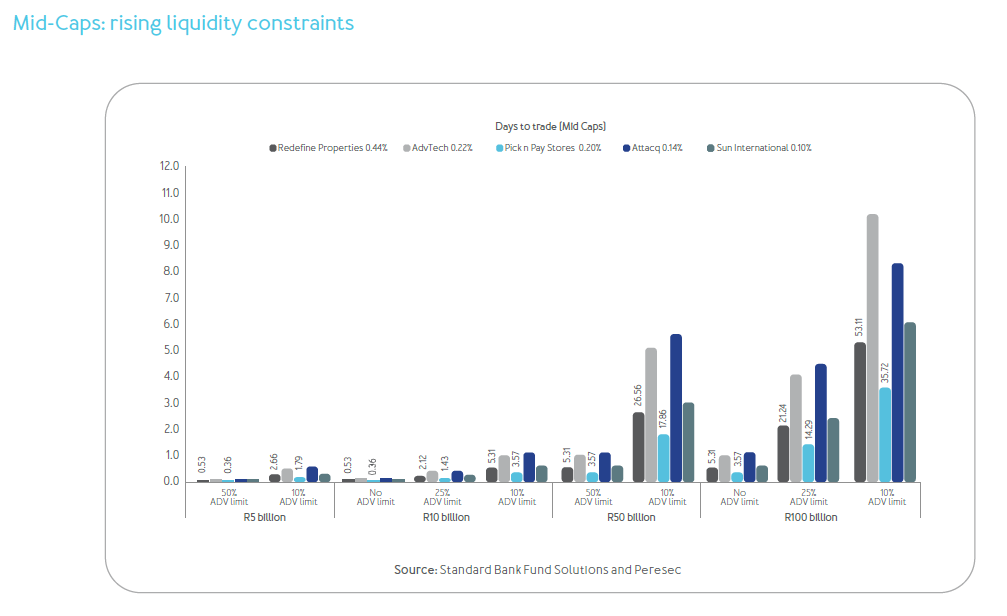
These constraints become even more pronounced in the mid-cap segment. Redefine Properties holds a 0.44% weight in the index. A R10 billion fund looking to buy at benchmark weight would need 0.53 days with no ADV constraint, 2.12 days at 25%, and 5.31 days at 10%.
Now scale that to a R100 billion fund. Even without an ADV constraint, it would take 5.31 days. With a 25% limit, that stretches to 21.24 days, and at 10%, to 53.11 days. That is more than two and a half months of trading days to build (or unwind) a fairly modest 0.44% holding.
If the fund manager wanted to take a more meaningful — say 2% — position in Redefine, the trading time would increase more than fourfold, approaching 100 trading days, even at a 25% ADV limit. Another property company, Attacq, presents even more pronounced constraints due to thinner trading volumes.
Let us consider another example: Pick ‘n Pay Stores (0.20% index weight). A R5 billion fund could trade a benchmark position in 0.36 days with a 50% ADV limit, or 1.79 days under a 10% ADV constraint. But for a R50 billion fund, the same trade would take 3.57 days at 50% — and nearly 18 days at a 10% ADV limit.

When moving into the small-cap space, execution can become materially more constrained.
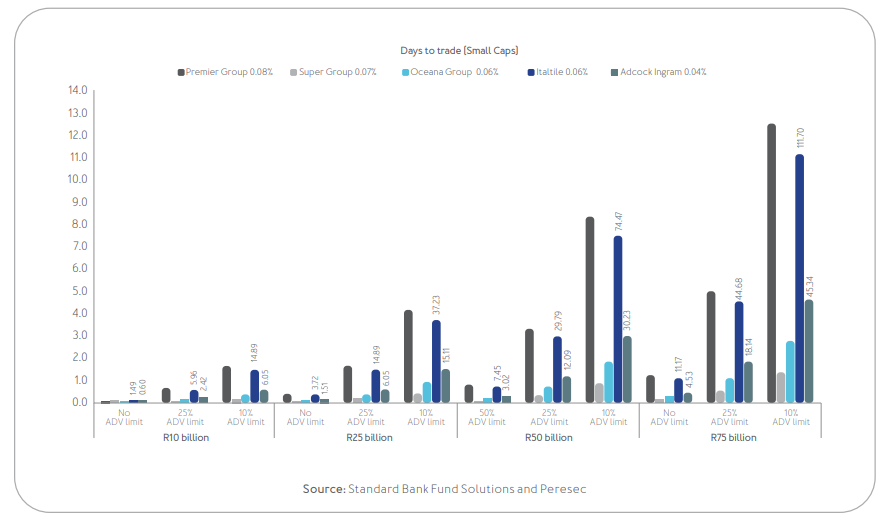

Take Italtile, with an index weight of only 0.06%, as another example. A R10 billion fund would need 1.49 days with no ADV limit, 5.96 days with a 25% limit or 14.89 days at a 10% constraint. A R50 billion fund? That jumps to 74.47 days with a 10% ADV limit — nearly 15 trading weeks. And if the fund wanted to build a 1% position, the timeline could stretch close to a full trading year.
Similarly, Adcock Ingram with an index weight of 0.04%, presents challenges. A R25 billion fund trading at benchmark weight would require 1.51 days with no ADV limit, 6.05 days with a 25% limit or 15.11 days at 10%. For a R75 billion fund, the same trade balloons to 45.34 days under a 10% ADV constraint.
Conclusion
Our analysis clearly demonstrates that smaller managers can benefit from greater trading agility — particularly in the less liquid segments of the market. The constraints that may be faced by larger managers — longer execution times, increased slippage, greater market impact, and limited access to smaller, potentially less liquid names — are far from trivial.
For smaller managers, the ability to act on a broader range of ideas — including mid- and small-cap names — can be advantageous, not necessarily in alpha generation, but through access to a wider opportunity set and greater portfolio flexibility.
That said, size alone does not determine success. Trading agility should not be mistaken for guaranteed outperformance — no clear relationship between the two has been established. Smaller funds are not inherently better positioned to outperform larger ones. Larger managers benefit from scale in other ways — lower trading costs, better access to deal flow and corporate management teams, and greater internal resources, including research and technology.
Ultimately, the challenge for large managers lies in balancing these strengths with the practical realities of deploying significant capital in a finite local market.